 Web Server Statistics for marx2mao.com Web Server Statistics for marx2mao.com
(Go To: Top: General Summary: Daily Summary: Hourly Summary: Domain Report: Organization Report: Operating System Report: Status Code Report: File Size Report: File Type Report: Directory Report: Request Report)
This report contains overall statistics.
Successful requests: 15,996
Average successful requests per day: 15,995
Successful requests for pages: 14,231
Average successful requests for pages per day: 14,230
Failed requests: 7,604
Redirected requests: 6
Distinct files requested: 3,201
Distinct hosts served: 5,248
Corrupt logfile lines: 235
Data transferred: 2.77 gigabytes
Average data transferred per day: 2.77 gigabytes
(Go To: Top: General Summary: Daily Summary: Hourly Summary: Domain Report: Organization Report: Operating System Report: Status Code Report: File Size Report: File Type Report: Directory Report: Request Report)
This report lists the total activity for each day of the week, summed over all the weeks in the report.
Each unit ( ) represents 400 requests
for pages or part thereof.
) represents 400 requests
for pages or part thereof.
day: #reqs: #pages: ---: -----: ------: Sun: 0: 0: Mon: 0: 0: Tue: 0: 0: Wed: 15995: 14230:Thu: 1: 1:
(Go To: Top: General Summary: Daily Summary: Hourly Summary: Domain Report: Organization Report: Operating System Report: Status Code Report: File Size Report: File Type Report: Directory Report: Request Report)
This report lists the total activity for each hour of the day, summed over all the days in the report.
Each unit () represents 50 requests
for pages or part thereof.
hour: #reqs: #pages: ----: -----: ------: 0: 607: 562:3: 541: 493:
(Go To: Top: General Summary: Daily Summary: Hourly Summary: Domain Report: Organization Report: Operating System Report: Status Code Report: File Size Report: File Type Report: Directory Report: Request Report)
This report lists the countries of the computers which requested files.
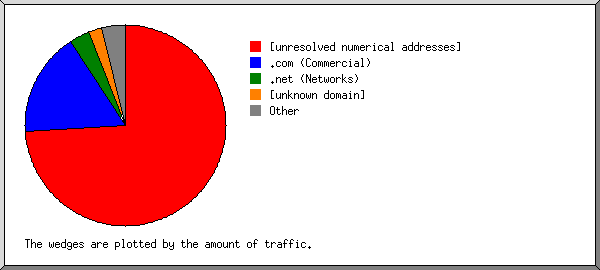
Listing domains, sorted by the amount of traffic.
#reqs: %bytes: domain
-----: ------: ------
 3516: 32.07%: [unresolved numerical addresses]
 3873: 30.93%: .com (Commercial)
  801: 19.26%: .ru (Russia)
 1634:  4.91%: .vn (Vietnam)
 2704:  4.35%: .net (Networks)
 2455:  3.13%: [unknown domain]
  259:  2.10%: .de (Germany)
   41:  0.38%: .br (Brazil)
   14:  0.26%: .nl (Netherlands)
   60:  0.25%: [domain not given]
    8:  0.17%: .pl (Poland)
    8:  0.16%: .uk (United Kingdom)
   25:  0.14%: .sg (Singapore)
    2:  0.14%: .bg (Bulgaria)
    8:  0.14%: .nz (New Zealand)
    2:  0.14%: .uy (Uruguay)
    2:  0.13%: .za (South Africa)
   22:  0.13%: .th (Thailand)
   17:  0.12%: .ca (Canada)
    1:  0.11%: .name (Individuals)
   13:  0.10%: .co (Colombia)
    2:  0.10%: .id (Indonesia)
   14:  0.09%: .mx (Mexico)
   20:  0.07%: .cn (China)
    4:  0.06%: .it (Italy)
   29:  0.05%: .io (British Indian Ocean Territory)
    2:  0.05%: .ua (Ukraine)
    5:  0.04%: .cl (Chile)
    3:  0.03%: .gt (Guatemala)
    3:  0.03%: .us (United States)
   30:  0.03%: .re (Reunion)
   60:  0.03%: .ch (Switzerland)
    3:  0.03%: .es (Spain)
   12:  0.03%: .tw (Taiwan)
    1:  0.03%: .pt (Portugal)
   19:  0.02%: .jp (Japan)
    8:  0.02%: .org (Non Profit Making Organizations)
    1:  0.02%: .md (Moldova)
    1:  0.02%: .py (Paraguay)
    4:  0.02%: .fr (France)
    3:  0.02%: .edu (US Higher Education)
   13:  0.01%: .tr (Turkey)
    1:  0.01%: .at (Austria)
   11:  0.01%: .in (India)
    4:  0.01%: .uz (Uzbekistan)
    2:  0.01%: .do (Dominican Republic)
    1:  0.01%: .pk (Pakistan)
    3:  0.01%: .ee (Estonia)
    5:  0.01%: .ar (Argentina)
    2:       : .sh (Saint Helena)
    2:       : .is (Iceland)
    5:       : .au (Australia)
    2:       : .bd (Bangladesh)
    1:       : .bo (Bolivia)
    1:       : .bm (Bermuda)
    1:       : .arpa (Arpanet)
    1:       : .gr (Greece)
    1:       : .se (Sweden)
    3:       : .ec (Ecuador)
    1:       : .jo (Jordan)
    1:       : .kh (Cambodia)
    1:       : .ph (Philippines)
    1:       : .az (Azerbaijan)
    1:       : .il (Israel)
    1:       : .cy (Cyprus)
   15:       : .cz (Czech Republic)
    1:       : .fi (Finland)
    1:       : .ro (Romania)
  140:       : .by (Belarus)
   85:       : .ml (Mali)
(Go To: Top: General Summary: Daily Summary: Hourly Summary: Domain Report: Organization Report: Operating System Report: Status Code Report: File Size Report: File Type Report: Directory Report: Request Report)
This report lists the organizations of the computers which requested files.
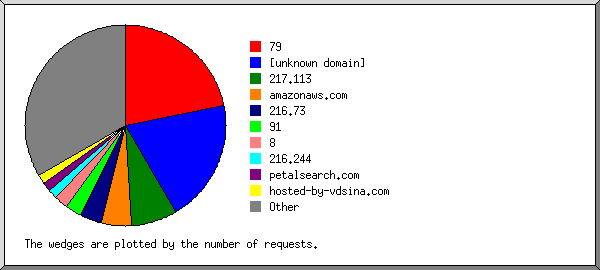
Listing the top 20 organizations by the number of requests, sorted by the number of requests.
#reqs: %bytes: organization
-----: ------: ------------
 2455:  3.13%: [unknown domain]
 2235:  0.03%: ahrefs.net
 1645:  1.71%: amazonaws.com
 1634:  4.91%: vn
  769: 18.89%: hosted-by-vdsina.ru
  409:  2.05%: petalsearch.com
  376:  5.24%: 216.244
  314:  0.89%: 216.73
  271:  0.48%: 43
  239:  0.04%: 91
  198:  2.57%: googlebot.com
  189:  2.04%: baidu.com
  179:  0.48%: hwclouds-dns.com
  176:  0.06%: 95
  175:  8.55%: google.com
  163:  4.20%: hosted-by-vdsina.com
  154:  0.40%: 123
  140:       : by
  123:  0.45%: apple.com
  119:  1.49%: versanet.de
 4033: 42.39%: [not listed: 736 organizations]
(Go To: Top: General Summary: Daily Summary: Hourly Summary: Domain Report: Organization Report: Operating System Report: Status Code Report: File Size Report: File Type Report: Directory Report: Request Report)
This report lists the operating systems used by visitors.
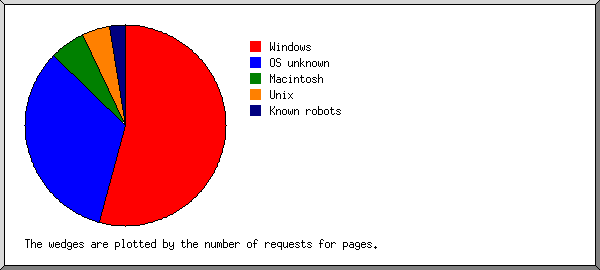
Listing operating systems, sorted by the number of requests for pages.
 #: #reqs: #pages: OS
--: -----: ------: --
 1:  6167:   5573: Windows
  :  5719:   5133:   Windows NT
  :   434:    431:   Unknown Windows
  :     4:      4:   Windows 2000
  :     9:      4:   Windows XP
  :     1:      1:   Windows 95
 2:  3297:   3096: OS unknown
 3:  3155:   2898: Known robots
 4:  2336:   1812: Macintosh
 5:  1014:    828: Unix
  :  1004:    818:   Linux
  :     9:      9:   Other Unix
  :     1:      1:   BSD
 6:     2:      0: OS/2
(Go To: Top: General Summary: Daily Summary: Hourly Summary: Domain Report: Organization Report: Operating System Report: Status Code Report: File Size Report: File Type Report: Directory Report: Request Report)
This report lists the HTTP status codes of all requests.
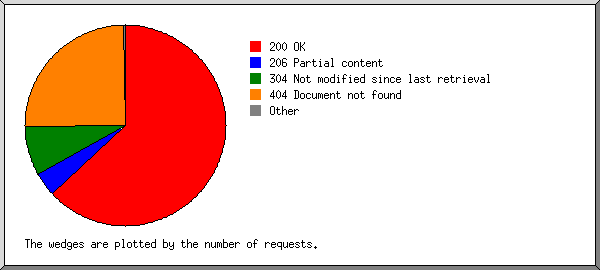
Listing status codes, sorted numerically.
#reqs: status code
-----: -----------
12717: 200 OK
  864: 206 Partial content
    6: 301 Document moved permanently
 2415: 304 Not modified since last retrieval
    2: 403 Access forbidden
 7598: 404 Document not found
    1: 405 Method not allowed
    2: 416 Requested range not valid
    1: 500 Internal server error
(Go To: Top: General Summary: Daily Summary: Hourly Summary: Domain Report: Organization Report: Operating System Report: Status Code Report: File Size Report: File Type Report: Directory Report: Request Report)
This report lists the sizes of files.
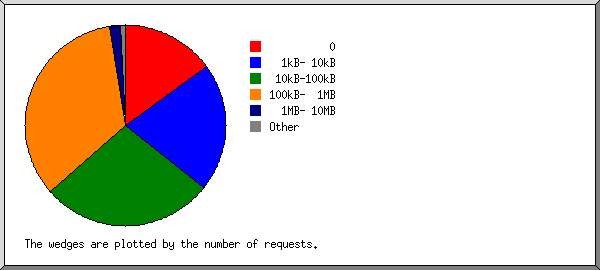
       size: #reqs: %bytes:
-----------: -----: ------:
          0:  3021:       :
   1B-  10B:    57:       :
  11B- 100B:     3:       :
 101B-  1kB:   227:       :
  1kB- 10kB:  4105:  0.80%:
 10kB-100kB:  4924:  5.16%:
100kB-  1MB:  3249: 57.06%:
  1MB- 10MB:   410: 36.98%:
(Go To: Top: General Summary: Daily Summary: Hourly Summary: Domain Report: Organization Report: Operating System Report: Status Code Report: File Size Report: File Type Report: Directory Report: Request Report)
This report lists the extensions of files.
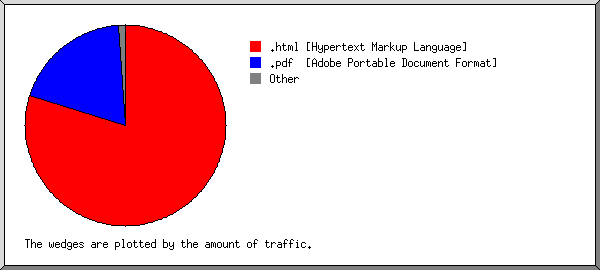
Listing extensions with at least 0.1% of the traffic, sorted by the amount of traffic.
#reqs: %bytes: extension
-----: ------: ---------
 9728: 56.31%: .html [Hypertext Markup Language]
 1071: 41.27%: .pdf  [Adobe Portable Document Format]
 4503:  1.13%: [directories]
  129:  1.10%: .txt  [Plain text]
  448:  0.11%: .GIF
  117:  0.08%: [not listed: 9 extensions]
(Go To: Top: General Summary: Daily Summary: Hourly Summary: Domain Report: Organization Report: Operating System Report: Status Code Report: File Size Report: File Type Report: Directory Report: Request Report)
This report lists the directories from which files were requested. (The figures for each directory include all of its subdirectories.)
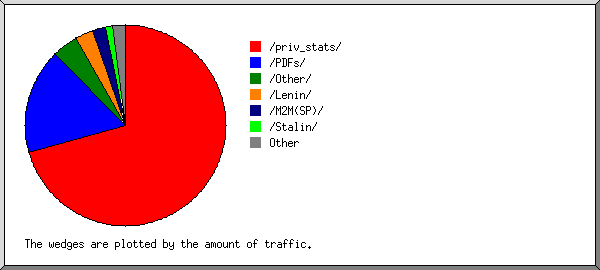
Listing directories with at least 0.01% of the traffic, sorted by the amount of traffic.
#reqs: %bytes: directory
-----: ------: ---------
 1077: 39.04%: /PDFs/
 3059: 38.24%: /priv_stats/
  967:  6.37%: /Other/
  691:  4.10%: http://
 2851:  3.83%: /Lenin/
 1535:  2.57%: /M2M(SP)/
  894:  2.07%: /Stalin/
  536:  1.84%: /M&E/
 1051:  0.94%: /Mao/
 3267:  0.87%: [root directory]
   26:  0.11%: /M%26E/
   18:  0.02%: /scratch/
   24:       : [not listed: 2 directories]
(Go To: Top: General Summary: Daily Summary: Hourly Summary: Domain Report: Organization Report: Operating System Report: Status Code Report: File Size Report: File Type Report: Directory Report: Request Report)
This report lists the files on the site.
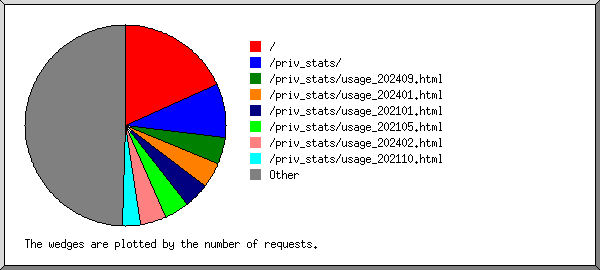
Listing files with at least 20 requests, sorted by the number of requests.
#reqs: %bytes:          last time: file
-----: ------: ------------------: ----
 2994:  0.52%: Apr/ 1/26 11:59 PM: /
 1219:  0.42%: Apr/ 1/26 11:59 PM: /priv_stats/
  864: 18.20%: Apr/ 1/26  6:38 PM: /priv_stats/usage_202603.html
  245:  6.22%: Apr/ 1/26 11:57 PM: /priv_stats/usage_202110.html
  102:  2.32%: Apr/ 1/26  8:38 PM: /priv_stats/usage_202602.html
   73:  1.69%: Apr/ 1/26  8:41 PM: /PDFs/Capital, 1.pdf
   69:  1.79%: Apr/ 1/26 11:49 PM: http://marx2mao.com/priv_stats/usage_202110.html
   57:  0.01%: Apr/ 1/26 11:38 PM: /M2M(428x256).GIF
   54:  0.01%: Apr/ 1/26 11:38 PM: /EDUCATNL.gif
   54:  0.77%: Apr/ 1/26  9:08 PM: /PDFs/MaoSW1.pdf
   44:  1.09%: Apr/ 1/26 11:36 PM: /PDFs/Lenin CW-Vol. 5.pdf
   44:  0.03%: Apr/ 1/26 11:38 PM: /RG.html
   40:  0.99%: Apr/ 1/26  7:59 PM: /priv_stats/usage_202512.html
   38:  0.43%: Apr/ 1/26 10:36 PM: /PDFs/StWorks1.pdf
   37:       : Apr/ 1/26 11:34 PM: /Mao/scratch/
   34:  1.00%: Apr/ 1/26 11:48 PM: /priv_stats/usage_201008.html
   28:  0.06%: Apr/ 1/26  9:15 PM: /M2M(SP)/Stalin(SP)/DHM38s.html
   27:  0.04%: Apr/ 1/26 11:13 PM: /Mao/Index.html
   26:  0.56%: Apr/ 1/26  8:06 PM: /PDFs/StWorks4.pdf
   26:  0.51%: Apr/ 1/26  4:26 PM: /PDFs/MaoSW2.pdf
   26:  2.65%: Apr/ 1/26 11:28 PM: /PDFs/Lenin CW-Vol. 37.pdf
   25:  0.03%: Apr/ 1/26  9:01 PM: /Mao/
   25:  0.59%: Apr/ 1/26  8:07 PM: /priv_stats/usage_202012.html
   24:  0.07%: Apr/ 1/26 11:13 PM: /Lenin/Index.html
   24:  0.02%: Apr/ 1/26 10:43 PM: /M2M(SP)/Stalin(SP)/SPQ27s.html
   22:  0.54%: Apr/ 1/26  9:27 PM: /priv_stats/usage_202202.html
   21:       : Apr/ 1/26 11:38 PM: /M2M(SP)/index(sp).html
   21:  0.11%: Apr/ 1/26 10:43 PM: /M2M(SP)/Stalin(SP)/FL24s.html
   21:  0.61%: Apr/ 1/26  6:32 PM: /priv_stats/usage_201211.html
   21:  0.18%: Apr/ 1/26 11:37 PM: /Mao/CSE58.html
   20:  0.02%: Apr/ 1/26 11:07 PM: /M2M(SP)/Lenin(SP)/PRSD99s.html
   20:  0.01%: Apr/ 1/26 10:58 PM: /Stalin/scratch/
   20:  0.02%: Apr/ 1/26  9:52 PM: /Stalin/SS46.html
   20:  0.59%: Apr/ 1/26  9:59 PM: /PDFs/Lenin CW-Vol. 12.pdf
   20:  0.01%: Apr/ 1/26  9:54 PM: /Other/
 9591: 57.91%: Apr/ 2/26 12:00 AM: [not listed: 2,985 files]
(Go To: Top: General Summary: Daily Summary: Hourly Summary: Domain Report: Organization Report: Operating System Report: Status Code Report: File Size Report: File Type Report: Directory Report: Request Report)


